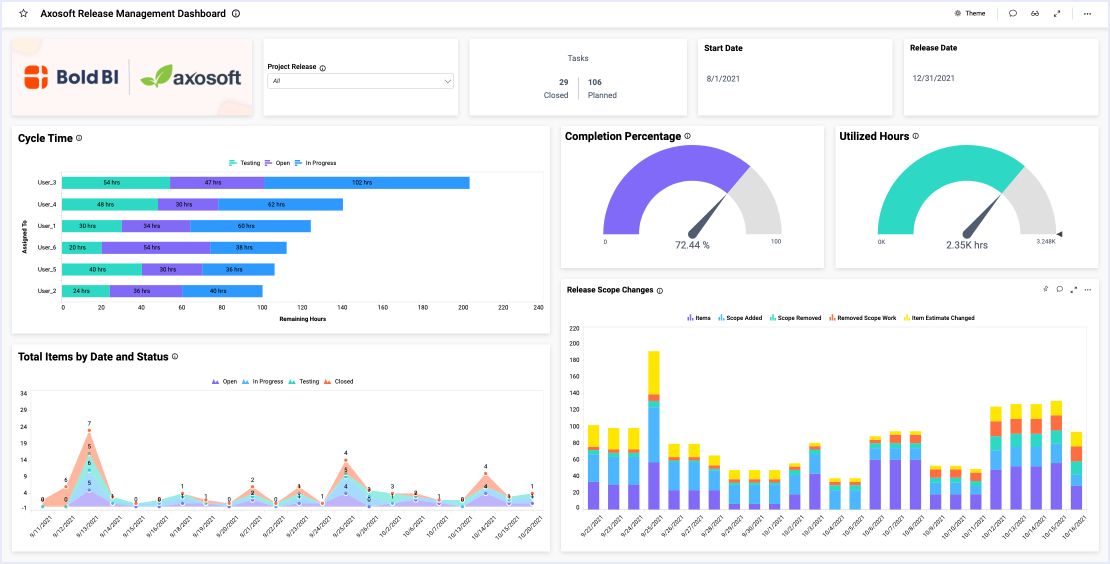


- How many support tickets have we received?
- How many tickets are resolved? On average, how long does it take us to resolve them?
- What do our support ticket statistics look like when broken down by issue type?
- How much downtime do our systems experience each month?
Ensure Customer Satisfaction
This IT operations dashboard’s information is essential because it offers insight into customer satisfaction and allows the IT team to identify where they are doing well and where they could improve.
Further, by utilizing the “Date” filter, users can choose to view data for any desired time period. This allows viewers to either view information for a short period of time or to consider trends that may be occurring over time.
For example, if I look at the data for all of 2018, I can see that the average number of hours it took to resolve a support issue was 31.14. From January 1 to March 25 of 2019, however, the average number of hours needed to resolve a support ticket was only 18.73. With this information, I could investigate whether the time difference is simply due to the sheer volume of tickets (perhaps the average number of hours spent on each ticket will continue to rise throughout 2019 and will also end up being roughly 30 hours) or whether there may be other contributing factors.
Track IT Operations by Ticket Resolution Time and Issue Type
The team’s overall numbers are certainly important. However, the “Average Time to Resolve Issue” and “Ticket Status by Issue Type” widgets are especially useful as they supply detailed information about the time taken to resolve specific issues and the number of resolved versus unresolved issues in each category. This illustrates how different types of issues affect the team’s overall numbers and can help the company ensure that resources and manpower are allocated appropriately.
Having all of these data sets available on a single IT operations dashboard is invaluable for team members who need an overview of the team’s day-to-day operations but also want to track key metrics over longer periods of time.